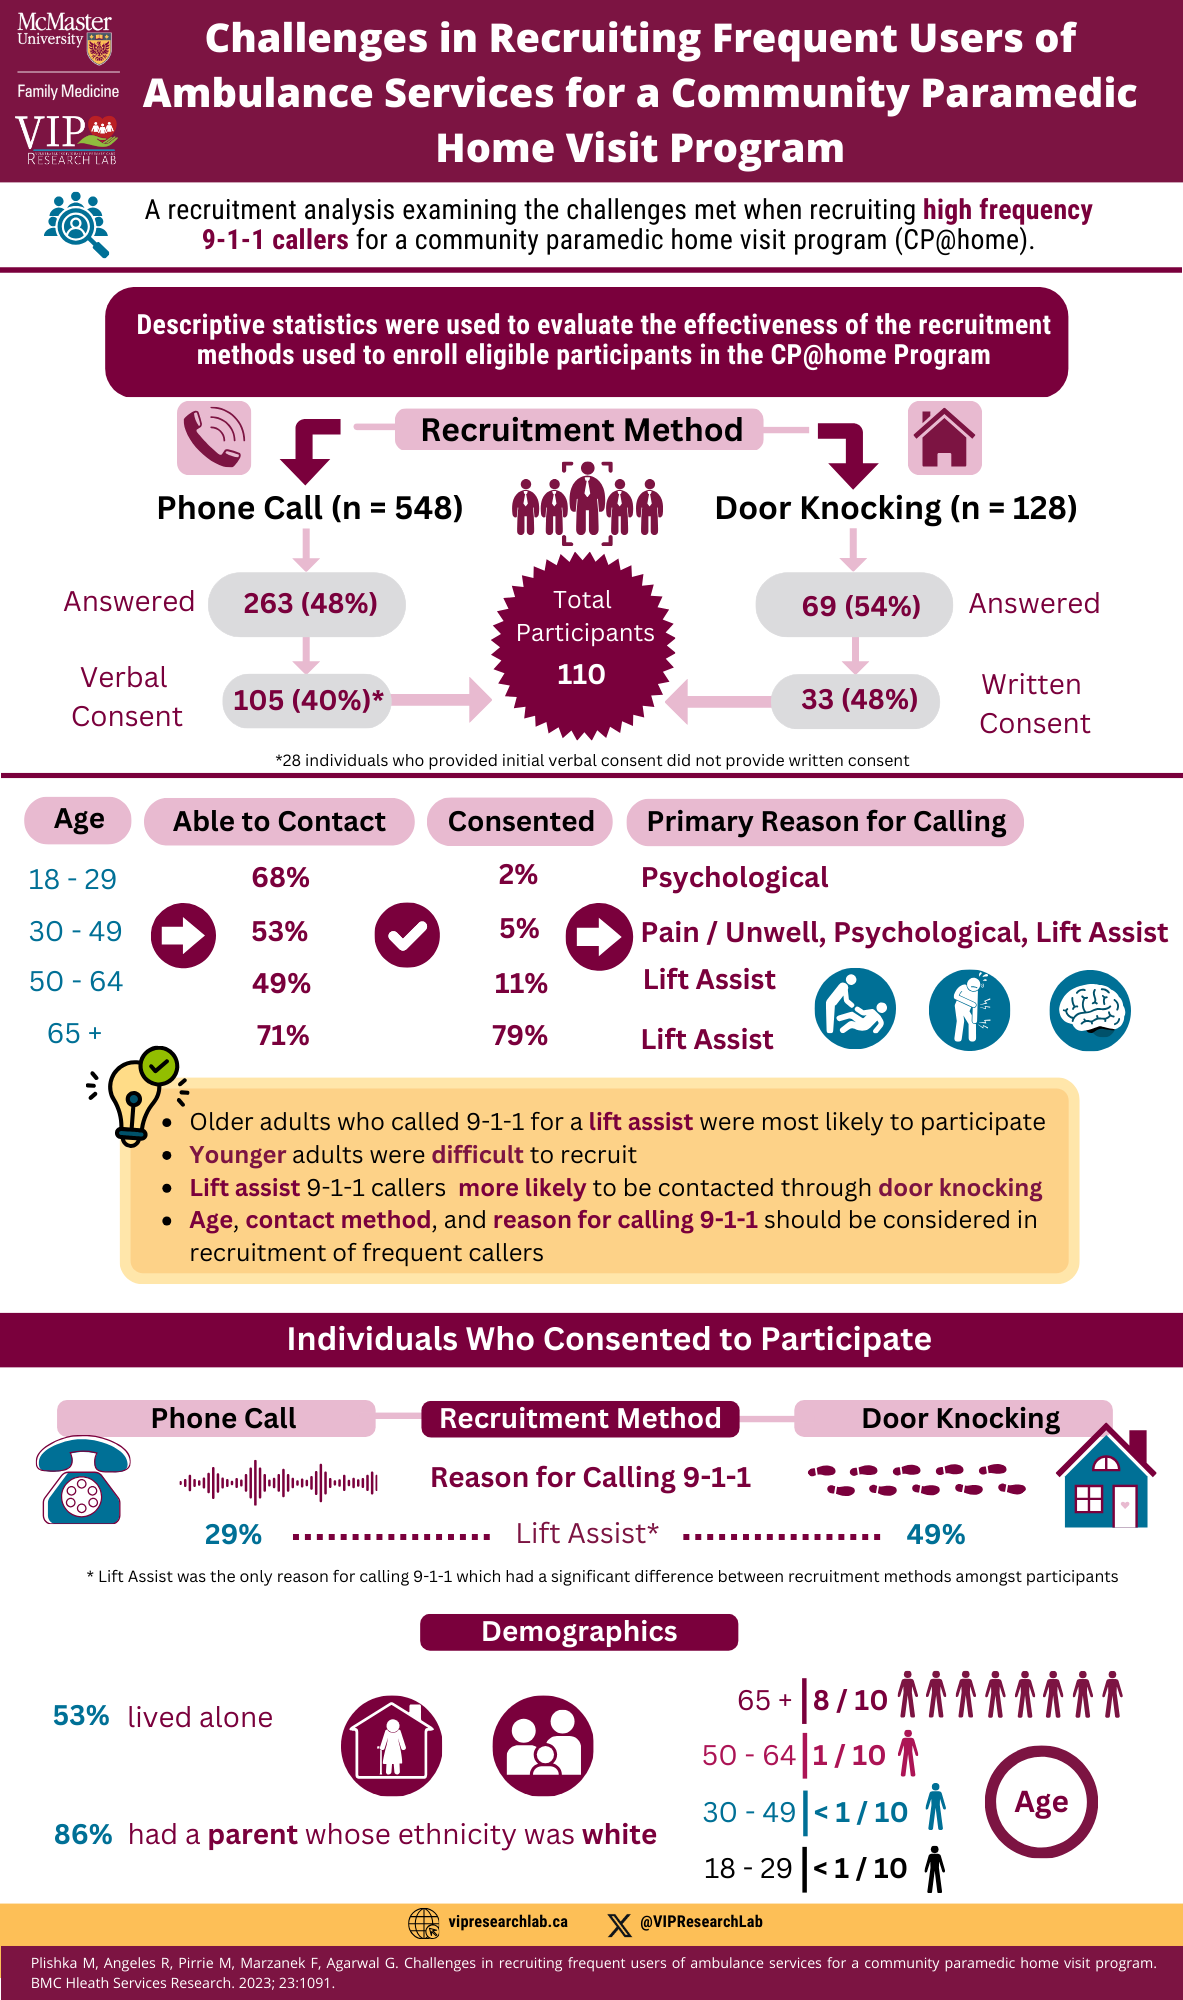
At the top of the page is a burgundy banner with the title of the infographic Challenges in Recruiting Frequent Users of Ambulance Services for a Community Paramedic Home Visit Program. To the left of the title are the logos for McMaster University Family Medicine and VIP Research Lab. Below that is text saying A recruitment analysis examining the challenges met when recruiting high frequency 9-1-1 callers for a community paramedic home visit program (CP@home) with a blue icon of a magnifying glass magnifying a person in a crowd. Below that is text written on a burgundy banner saying Descriptive statistics were used to evaluate the effectiveness of the recruitment methods used to enroll eligible participants in the CP@home Program. Below that is a flow chart with the title Recruitment Method. To its right are an icon of a house and an arrow pointing downward to the text saying Door Knocking (n=128), with another arrow pointing down to 69 (54%) Answered and another arrow pointing down to 33 (48%) Written Consent. An arrow from the last text points to the middle of the page to a circular burgundy badge with text saying Total Participants 110 on it. Above that is an icon of 5 people standing beside one another. To the left of the Recruitment Method subheading is an icon of a phone ringing and an arrow pointing downwards to the text saying Phone Call (n = 548), another arrow beneath that saying Answered 263 (48%), and another arrow pointing down to Verbal Consent 105 (40%)*. The * appears at below this with text beside it saying 28 individuals who provided initial verbal consent did not provide written consent. An arrow beside Verbal Consent 105 (40%)* also points to the badge in the middle of the page which says Total Participants 110. In the middle of the page is a section with four columns that state Age, Able to Contact, Consented, and Primary Reason for Calling from left to write. There are 4 rows below this. The first row indicates that for the age group 18-29, it was possible to contact 68% of them, 2% consented, and psychological was the primary reason for calling. Below that for the age range 30-49, 53% were contacted, 5% consented, and being in pain/unwell, psychological, and Lift Assist was listed as the primary reason for calling. The next row represents the age group 50-64 and indicates that 49% were contacted, 11% consented, and lift assist was the primary reason for calling. The last row represents people over 65 years of age and states that 71% were contacted, 79% consented, and the primary reason for calling was lift assist. To the left of the text are three white icons with blue circular backgrounds. The first icon shows a person helping someone who has fallen to get up. The second one represents a person in pain. The third one is an icon of a brain. Below these rows is a yellow box with a lightbulb icon at the top right. There are four bullet points in this box with text saying Older adults who called 9-1-1 for a lift assist were most likely to participate, Younger adults were difficult to recruit, Lift assist 9-1-1 callers were more likely to be contacted through door knocking, Age, contact method, and reason for calling 9-1-1 should be considered in recruitment of frequent callers. Towards the bottom one-third of the page is a banner with the heading Individuals Who Consented to Participate. Below that in the middle is a subheading that says Recruitment Method, with text below it saying Reasons for Calling 9-11-1 and Lift Assist* below that. To its right is text saying Door Knocking with footsteps and a house icon below it and 49% below that for Lift Assist. To its right is text saying Phone Call with an icon of a telephone and phone ring below that and 29% for Lift Assist beneath that. At the bottom of these is a * with text beside it saying Lift Assist was the only reason for calling 9-1-1 which had a significant difference between recruitment methods amongst participants. Below that is a subheading that says Demographics. Below that, to the left, it says 53% lived alone, and 86% had a parent whose ethnicity was white below that. Towards the center is an icon of an old woman in a house and another icon of a family. To the right are age ranges with icons of people. At the top is 65+ with 8/10 beside it. Beneath that is 50-64 with 1/10 beside it. Below that is 30-49 with
